Dynamics and energy budgets of oceanic general circulation and mesoscale eddies
We have explored the dynamics and energy budgets of the oceanic general circulation and its associated mesoscale eddy field in a number of papers employing idealized models, realistic ocean general circulation models, in-situ observations, and satellite observations.
The wind puts about 1 TW of energy into the oceanic general circulation and mesoscale eddy field. The mesoscale eddies, which have length scales of order 100 km and time scales of order 30 days, arise from instabilities of the general circulation. In recent years there has been an explosion of interest in, and knowledge of, submesoscale eddies, which as the name implies have smaller scales than mesocale eddies.
A question of great interest for the oceanographic community is the fate of the energy put into the eddying general circulation. We have examined several aspects of this question. In Sen et al. (2008), Arbic et al. (2009), and Wright et al. (2012) we demonstrated that an important fraction of the wind power input is likely dissipated by quadratic bottom boundary layer drag. In Trossman et al. (2013, 2016) we implemented a parameterized topographic internal lee wave drag scheme into global eddying simulations of the HYbrid Coordinate Ocean Model. Trossman et al. (2013, 2016) showed that wave drag impacts the ocean model energy budget to first order, and has a measurable impact on the statistics of mesoscale eddies in the model. Trossman et al. (2015) compared the dissipation predicted by parameterized drag schemes with measurements made from microstructure observations.
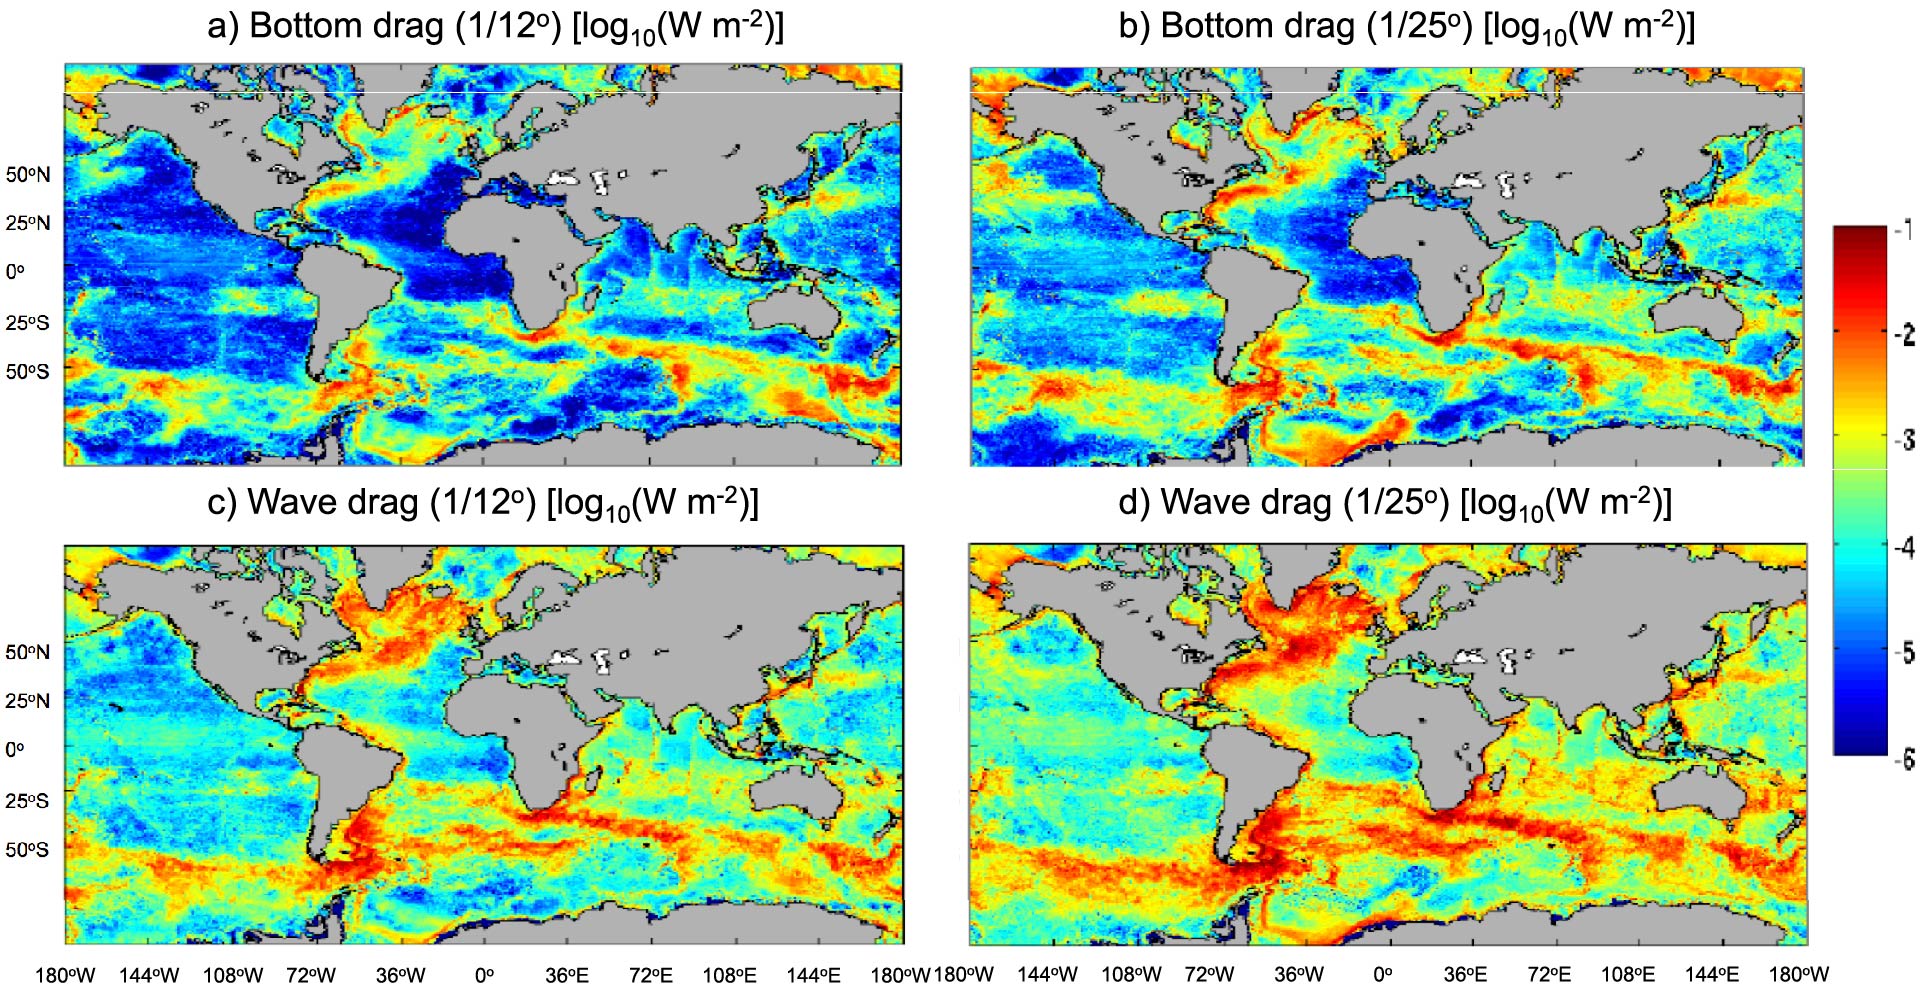
The base 10 logarithm of the energy dissipation [units in W m^¯²] associated with (a-b) quadratic bottom boundary layer drag and (c-d) parameterized topographic internal lee wave drag in the (a-c) 1/12° and (b-d) 1/25° HYCOM simulations with inline wave drag. An average over the final year of the simulations has been performed. From Trossman et al. (2016).
The oceanic inverse kinetic energy cascade has been explored using spectral kinetic energy fluxes in Scott and Arbic (2007) , who showed that baroclinic kinetic energy undergoes an inverse cascade alongside the well-known barotropic inverse cascade, and Arbic et al. (2013), which showed that the forward cascade at smaller scales seen in gridded satellite altimeter products may be imitated in idealized quasi-geostrophic turbulence models with something akin to an eddy viscosity, but may also be due to the spatial and temporal filtering inherent in the construction of the gridded products.
The impact of bottom drag on eddy statistics was examined in idealized models in Arbic et al. (2004—JPO pp. 2257-2273) , Arbic et al. (2007), and Arbic and Scott (2008). As in other studies, we found a great sensitivity of eddy horizontal length scales, energy levels, and vertical structure to the strength of bottom drag. Our work explored baroclinic QG turbulence with quadratic bottom drag for the first time, and explored the strong drag limit of QG turbulence for the first time. Trossman et al. (2017) demonstrated that the sensitivities of eddy vertical structure to drag strength seen in idealized QG turbulence models are also seen in more realistic ocean general circulation models, but that the sensitivities of eddy horizontal length scales to bottom drag are greatly reduced in realistic models, due to the mediating effects of bottom topography.
In other papers on this topic, we have examined the dynamics of vortices and jets in Arbic et al. (2003, 2004—JPO pp. 77-93), Scott et al. (2008), and Morten et al. (2017), and we explored the use of higher-order stencils to compute geostrophic velocities from altimeter sea surface heights (Arbic et al. 2012 JGR). The latter paper inspired AVISO to use higher-order stencils to compute geostrophic velocities in its products.
We have compared the low-frequency eddy kinetic energy (presumed to be dominated by mesoscale eddies) in several realistic oceanic general circulation models with low-frequency eddy kinetic energy computed from moored current meters (Scott et al. 2010). We have performed a philosophically similar exercise for tidal kinetic energy in Timko et al. (2012, 2013), and for low-frequency eddy available potential energy in Luecke et al. (2017). The Luecke et al. (2017) study also includes comparisons of modeled EAPE with EAPE computed from Argo by other investigators (Roullet et al. 2014).
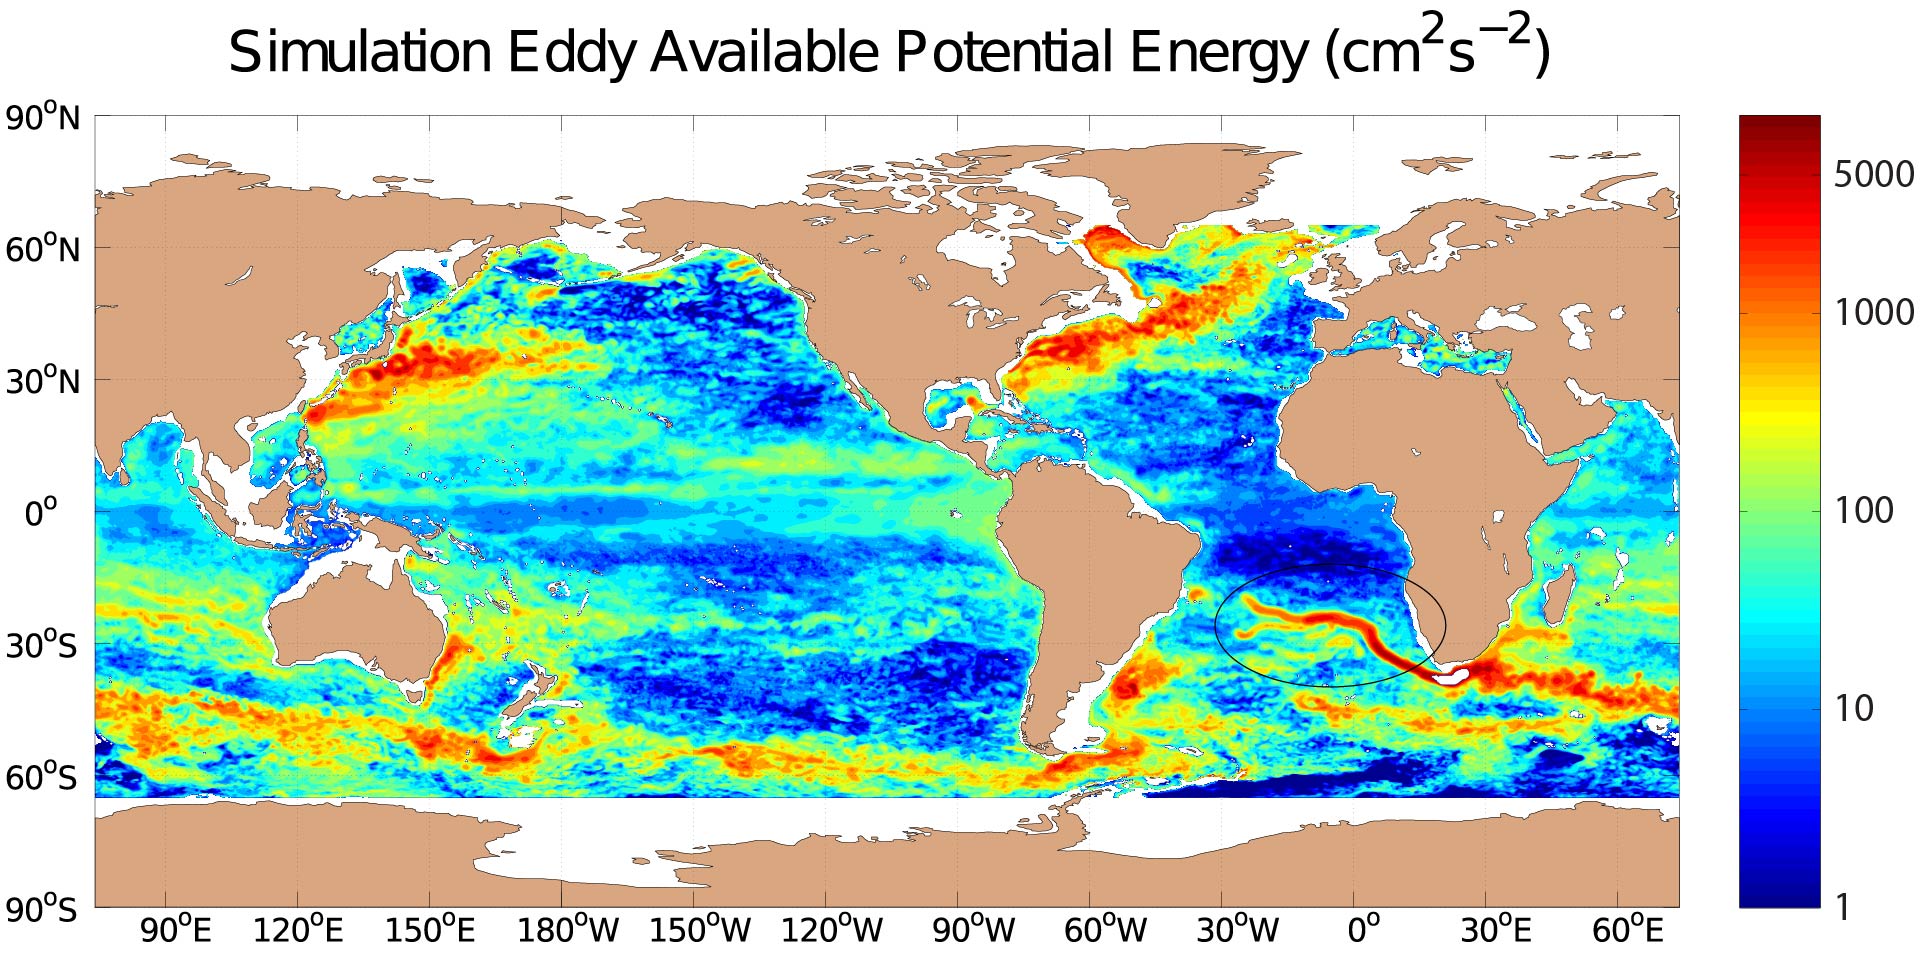
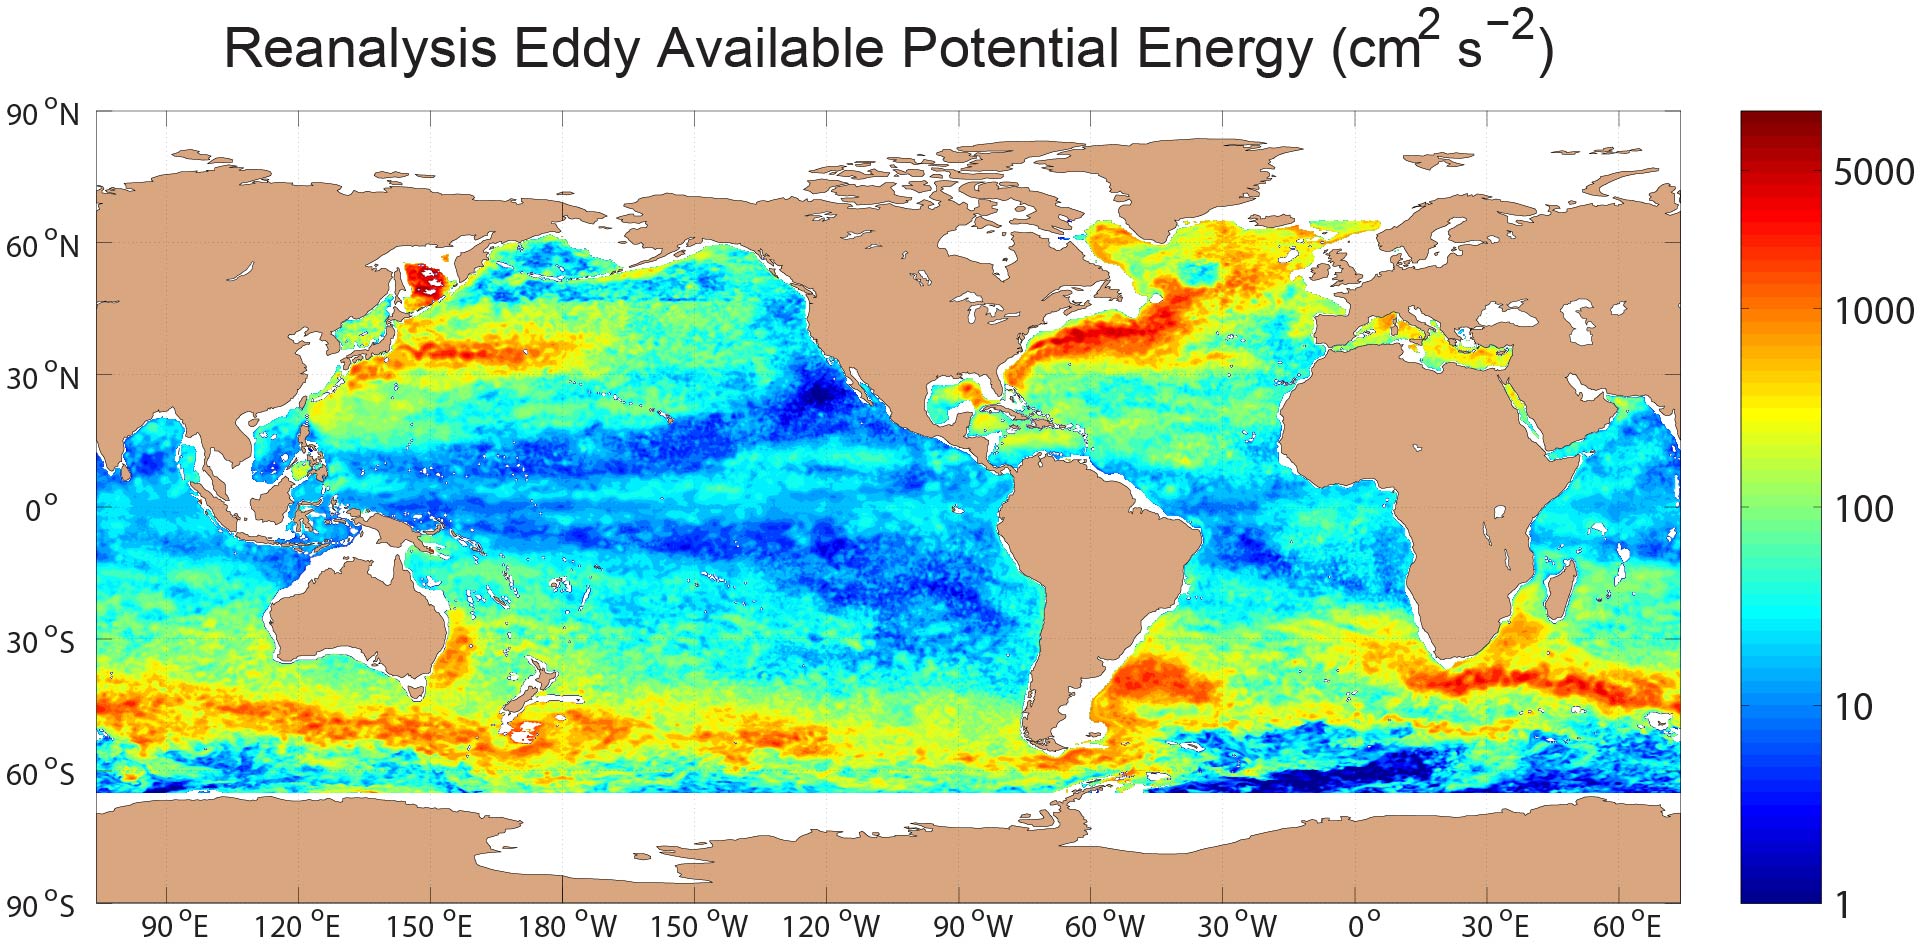
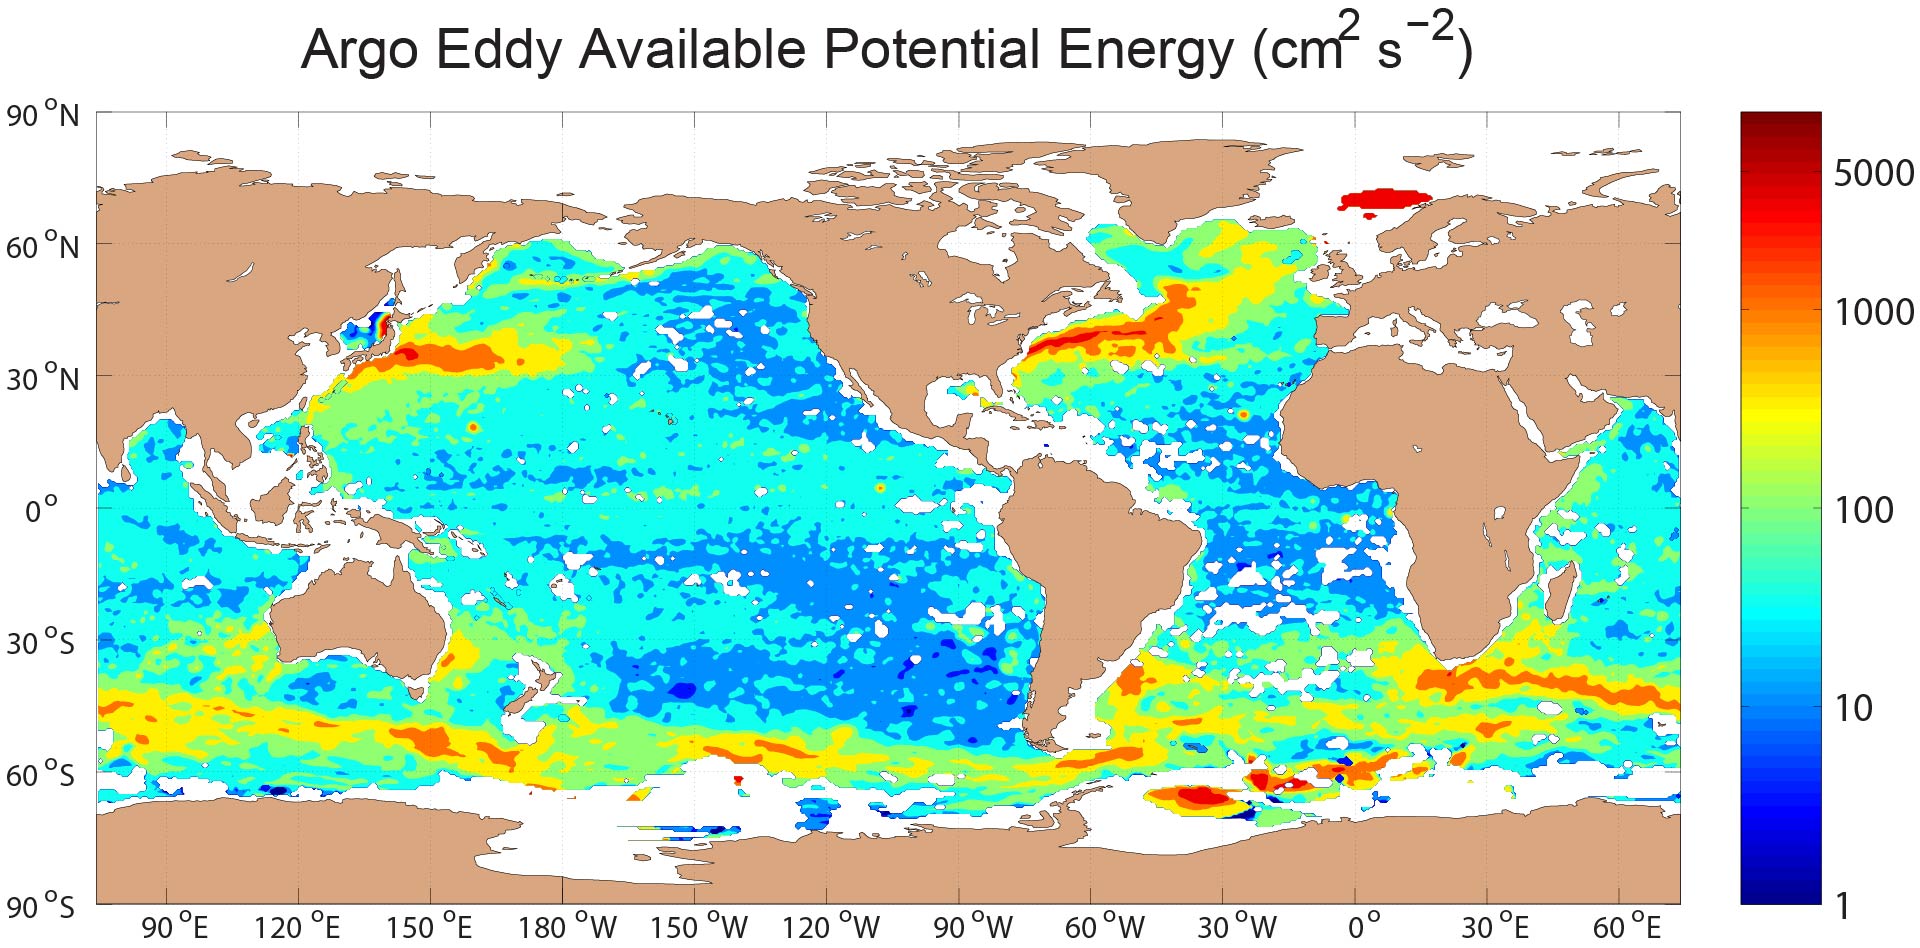
Global EAPE (cm^² s^¯² i.e.) at 500 meters depth in the (top) HYCOM simulation, (middle) HYCOM reanalysis, and (bottom) Roullet et al. (2014) Argo analysis. The eddy “train” discussed in the results section of Luecke et al. (2017) is encircled in the top sub-figure. In this figure, both HYCOM maps are given on a ¼° grid while the Argo map is shown on its native 1/2° resolution. From Luecke et al. (2017).


