Global modeling of internal tides and the internal gravity wave continuum
Gravity waves are waves for which gravity acts as the restoring force. Internal gravity waves are waves that exist because of stratification—e.g., the differences in density between lighter waters in the upper ocean and heavier waters in the deep ocean. When parcels oscillate up-and-down in a stratified fluid, there is a gravitational restoring force due to the differences in density between fluids at different vertical levels. Internal tides are internal gravity waves with tidal frequencies. The internal gravity wave continuum consists of gravity waves with supertidal frequencies e.g., frequencies that are greater than the tidal frequency.
Our group has been involved in several key steps on the path towards global modeling of internal tides and the internal gravity wave continuum.
Our group published the first global simulations of internal tides
(Arbic et al. 2004 – Deep-Sea Research II, Simmons et al. 2004 – Deep-Sea Research II).
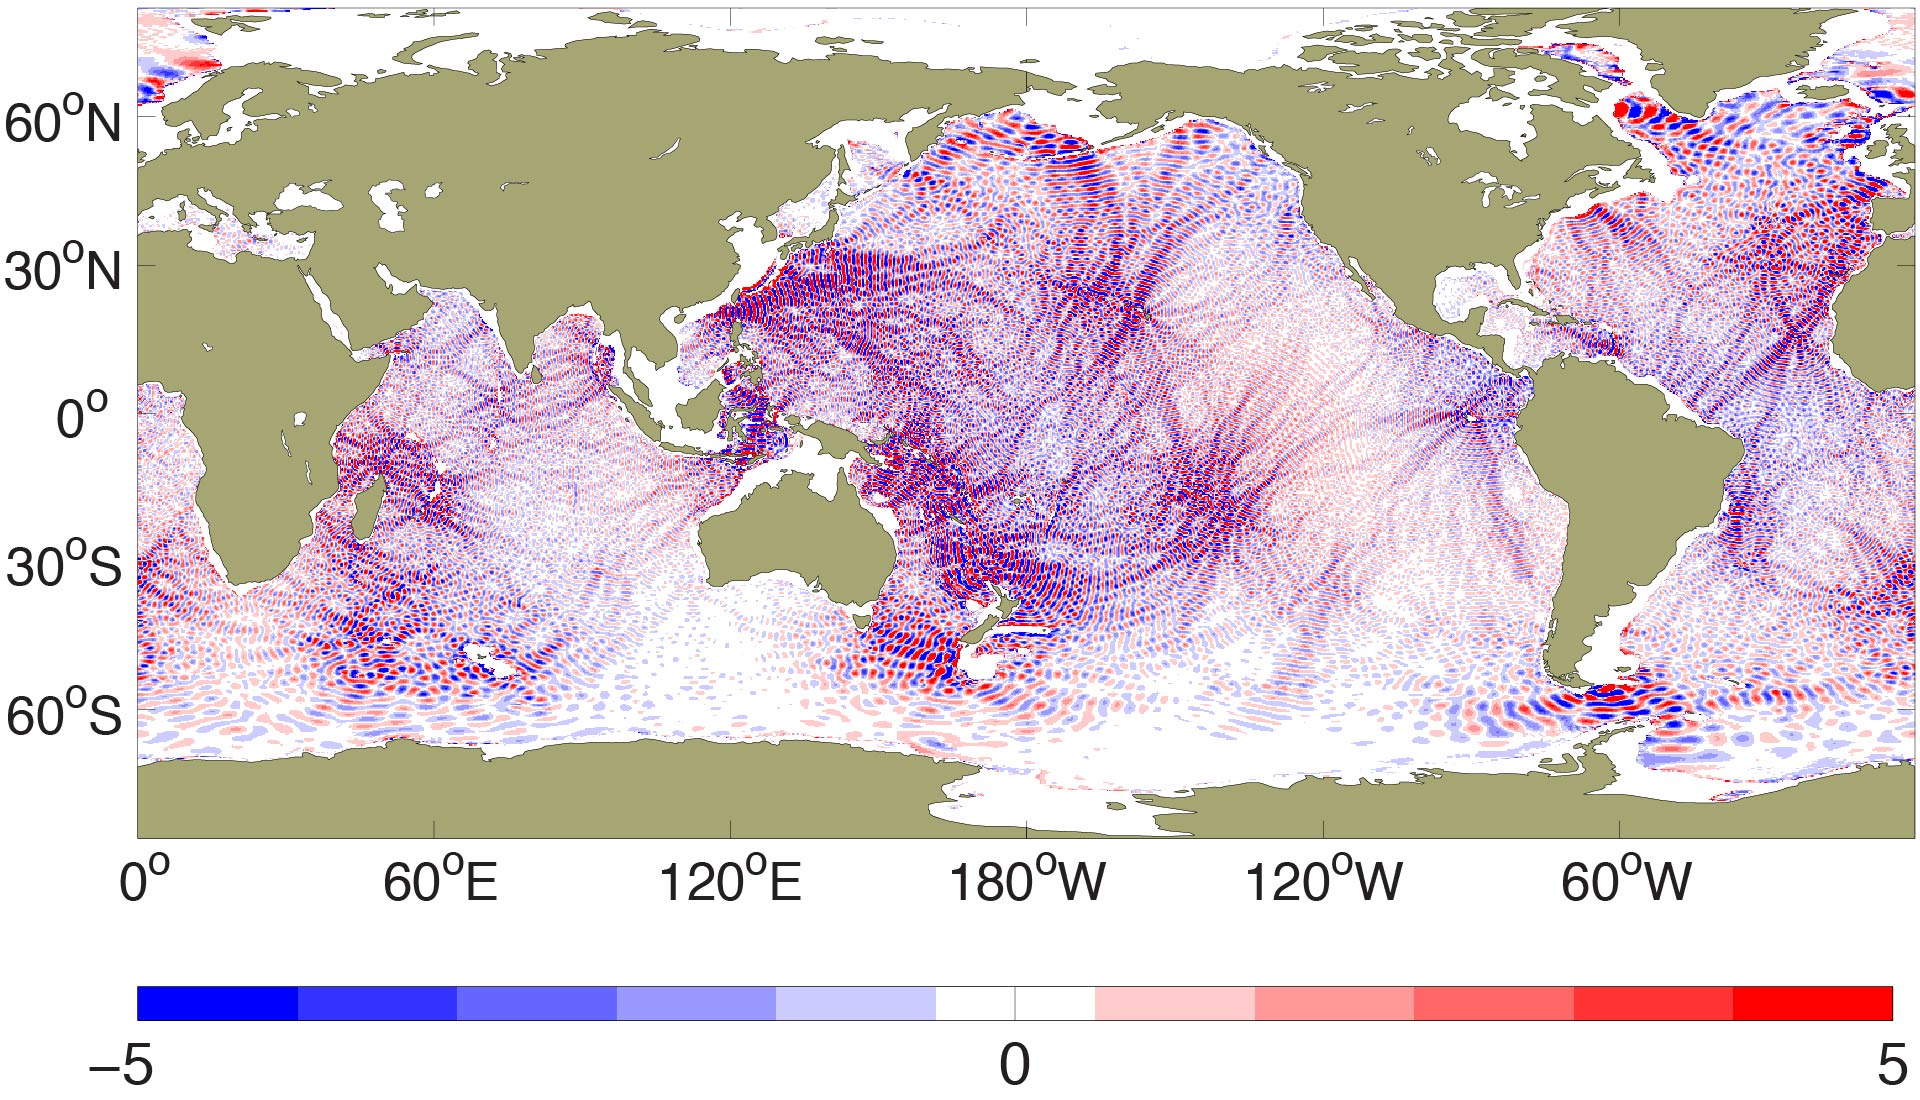
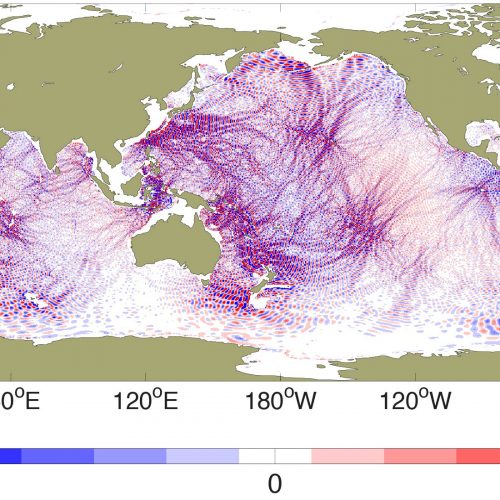
Snapshot of interfacial height (m) in ¼ degree M_{₂}-only two-layer run with a multiplicative factor of 8, taken after the model has equilibrated. The lower layer only exists where the water column depth exceeds 700 m. From Arbic et al. (2004—Deep-Sea Research II).
Our group published the first high-resolution global simulations with concurrent atmospheric and tidal forcing (Arbic et al. 2010). This combination of forcing and resolution implies that near-inertial waves, mesoscale eddies, barotropic tides, and baroclinic (internal) tides will all coexist in the model, as they do in the actual ocean.
Because of the atmospheric forcing, the internal tides in such simulations propagate in a realistic horizontally varying stratification, thus allowing for realistic comparisons of modeled vs. observed internal tides (Timko et al. 2012, 2013).
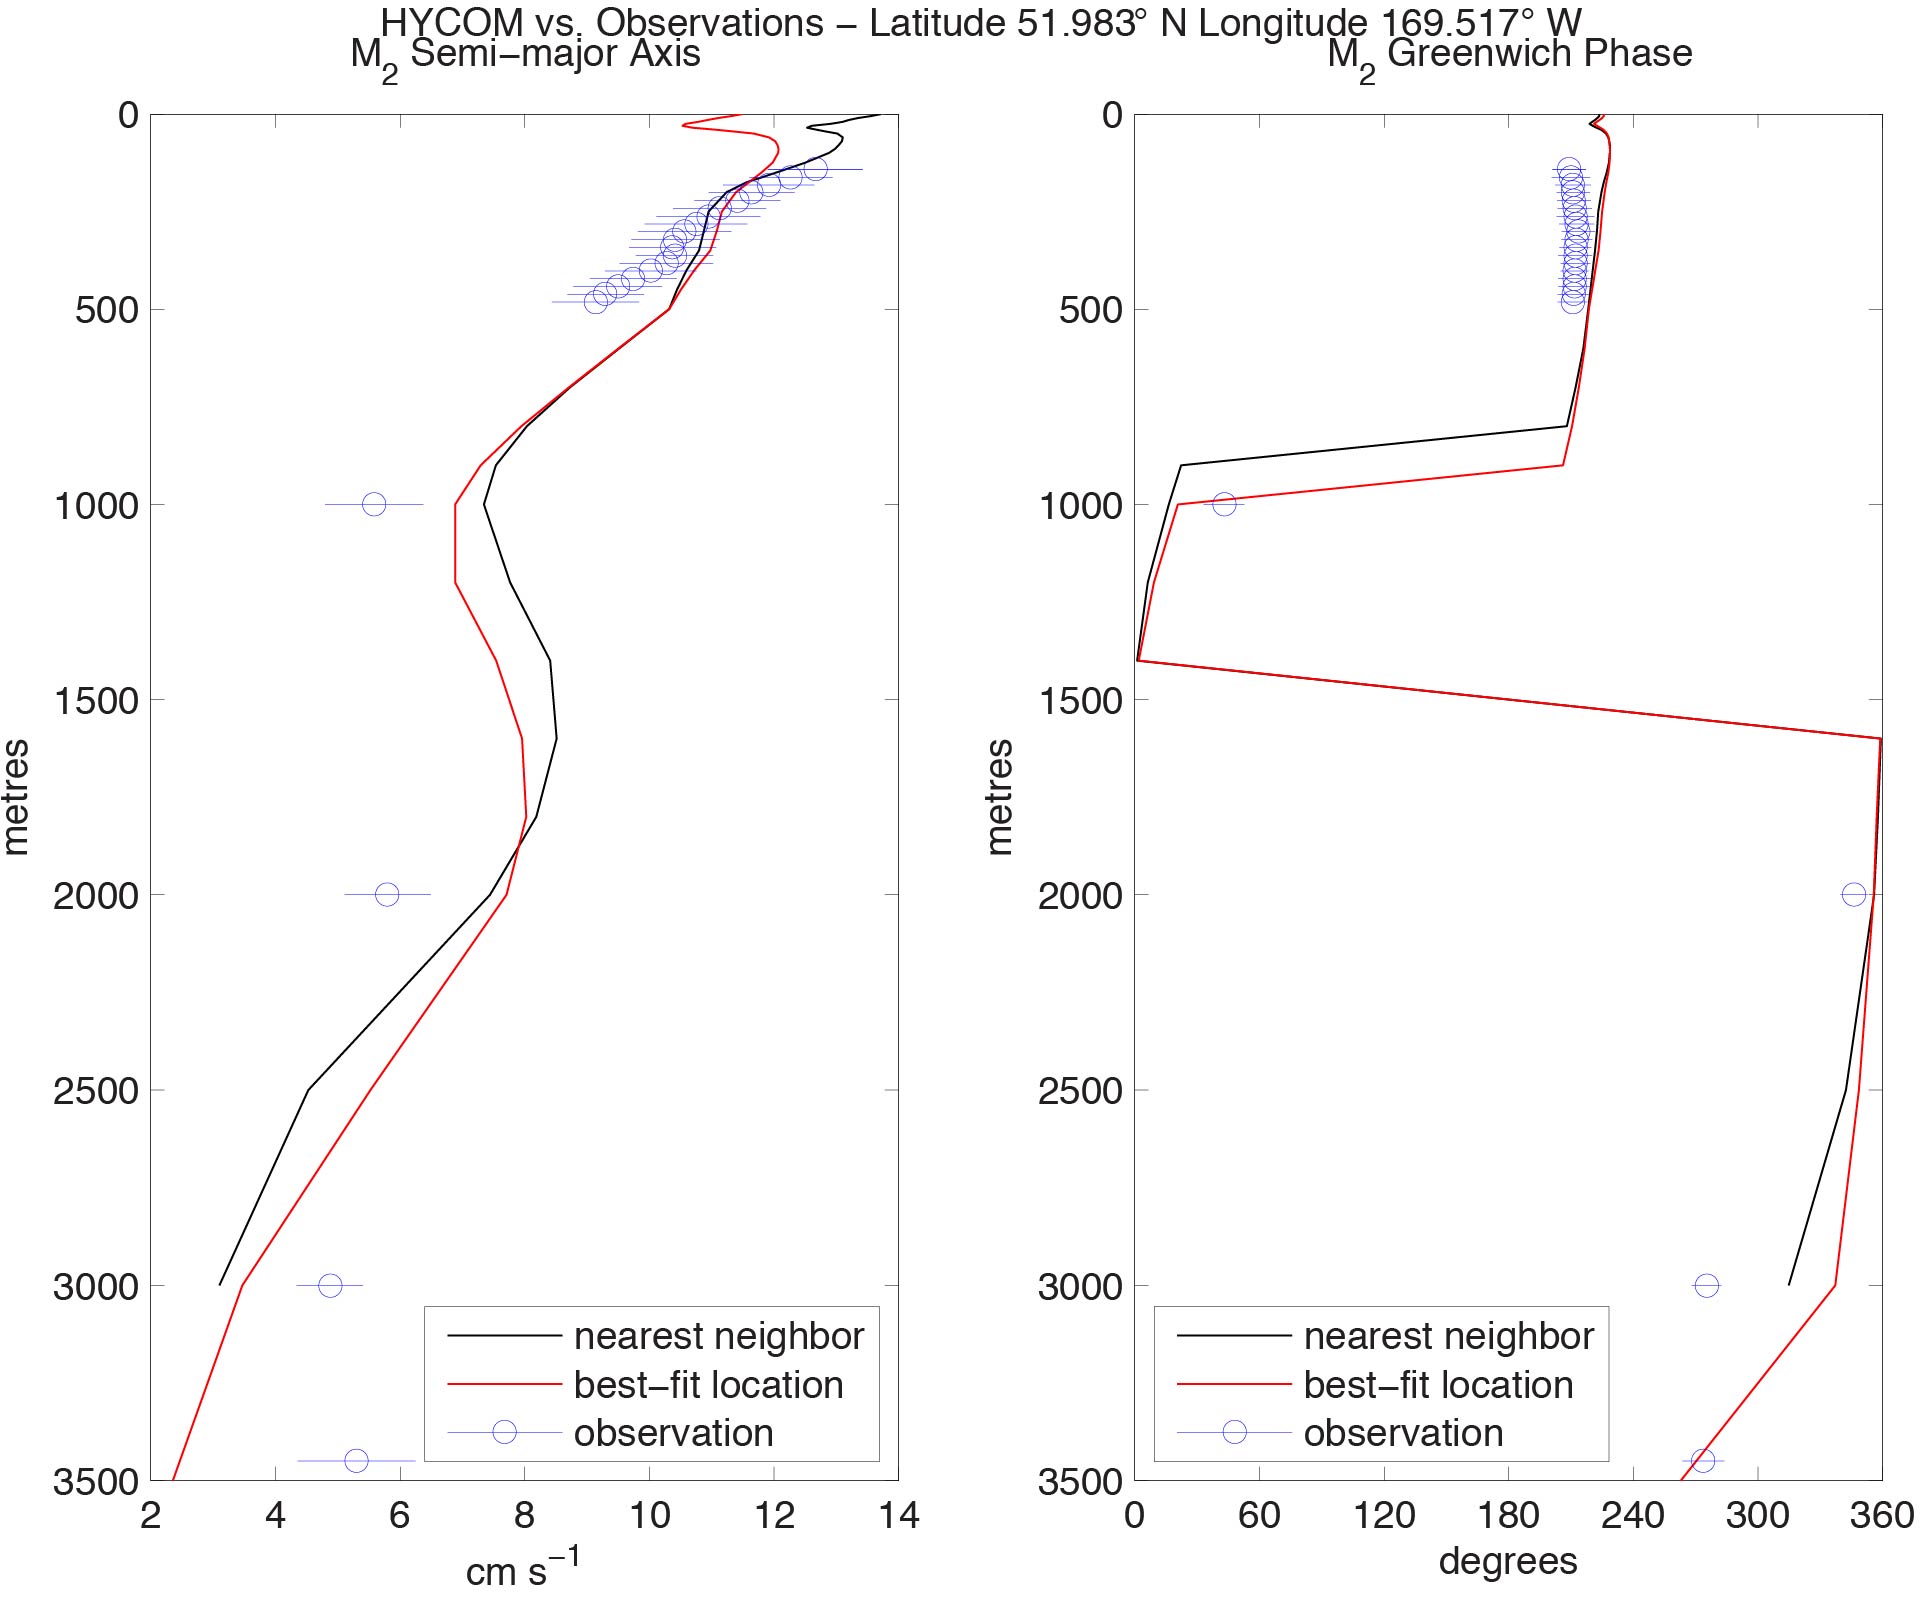
Comparison of M_{₂} semimajor axis and Greenwich phase in HYCOM and in a particular ADCP record as a function of depth. See plot title for ADCP location. The circles represent the value estimated from the observations and the line through the circle represents the 95% confidence intervals using harmonic tidal analysis. The black curve shows HYCOM model values for the model grid point nearest the observation and the red curve shows the model values for the best-fit neighbor from a 9 point block of grid cells surrounding the observation. From Timko et al. (2013).
Mesoscale eddies scatter low-mode internal tides, thus rendering some of the internal tide energy incoherent. We have quantified this effect in different ways in Shriver et al. (2014), Ansong et al. (2017), Savage et al. (2017), and Buijsman et al. (2017).
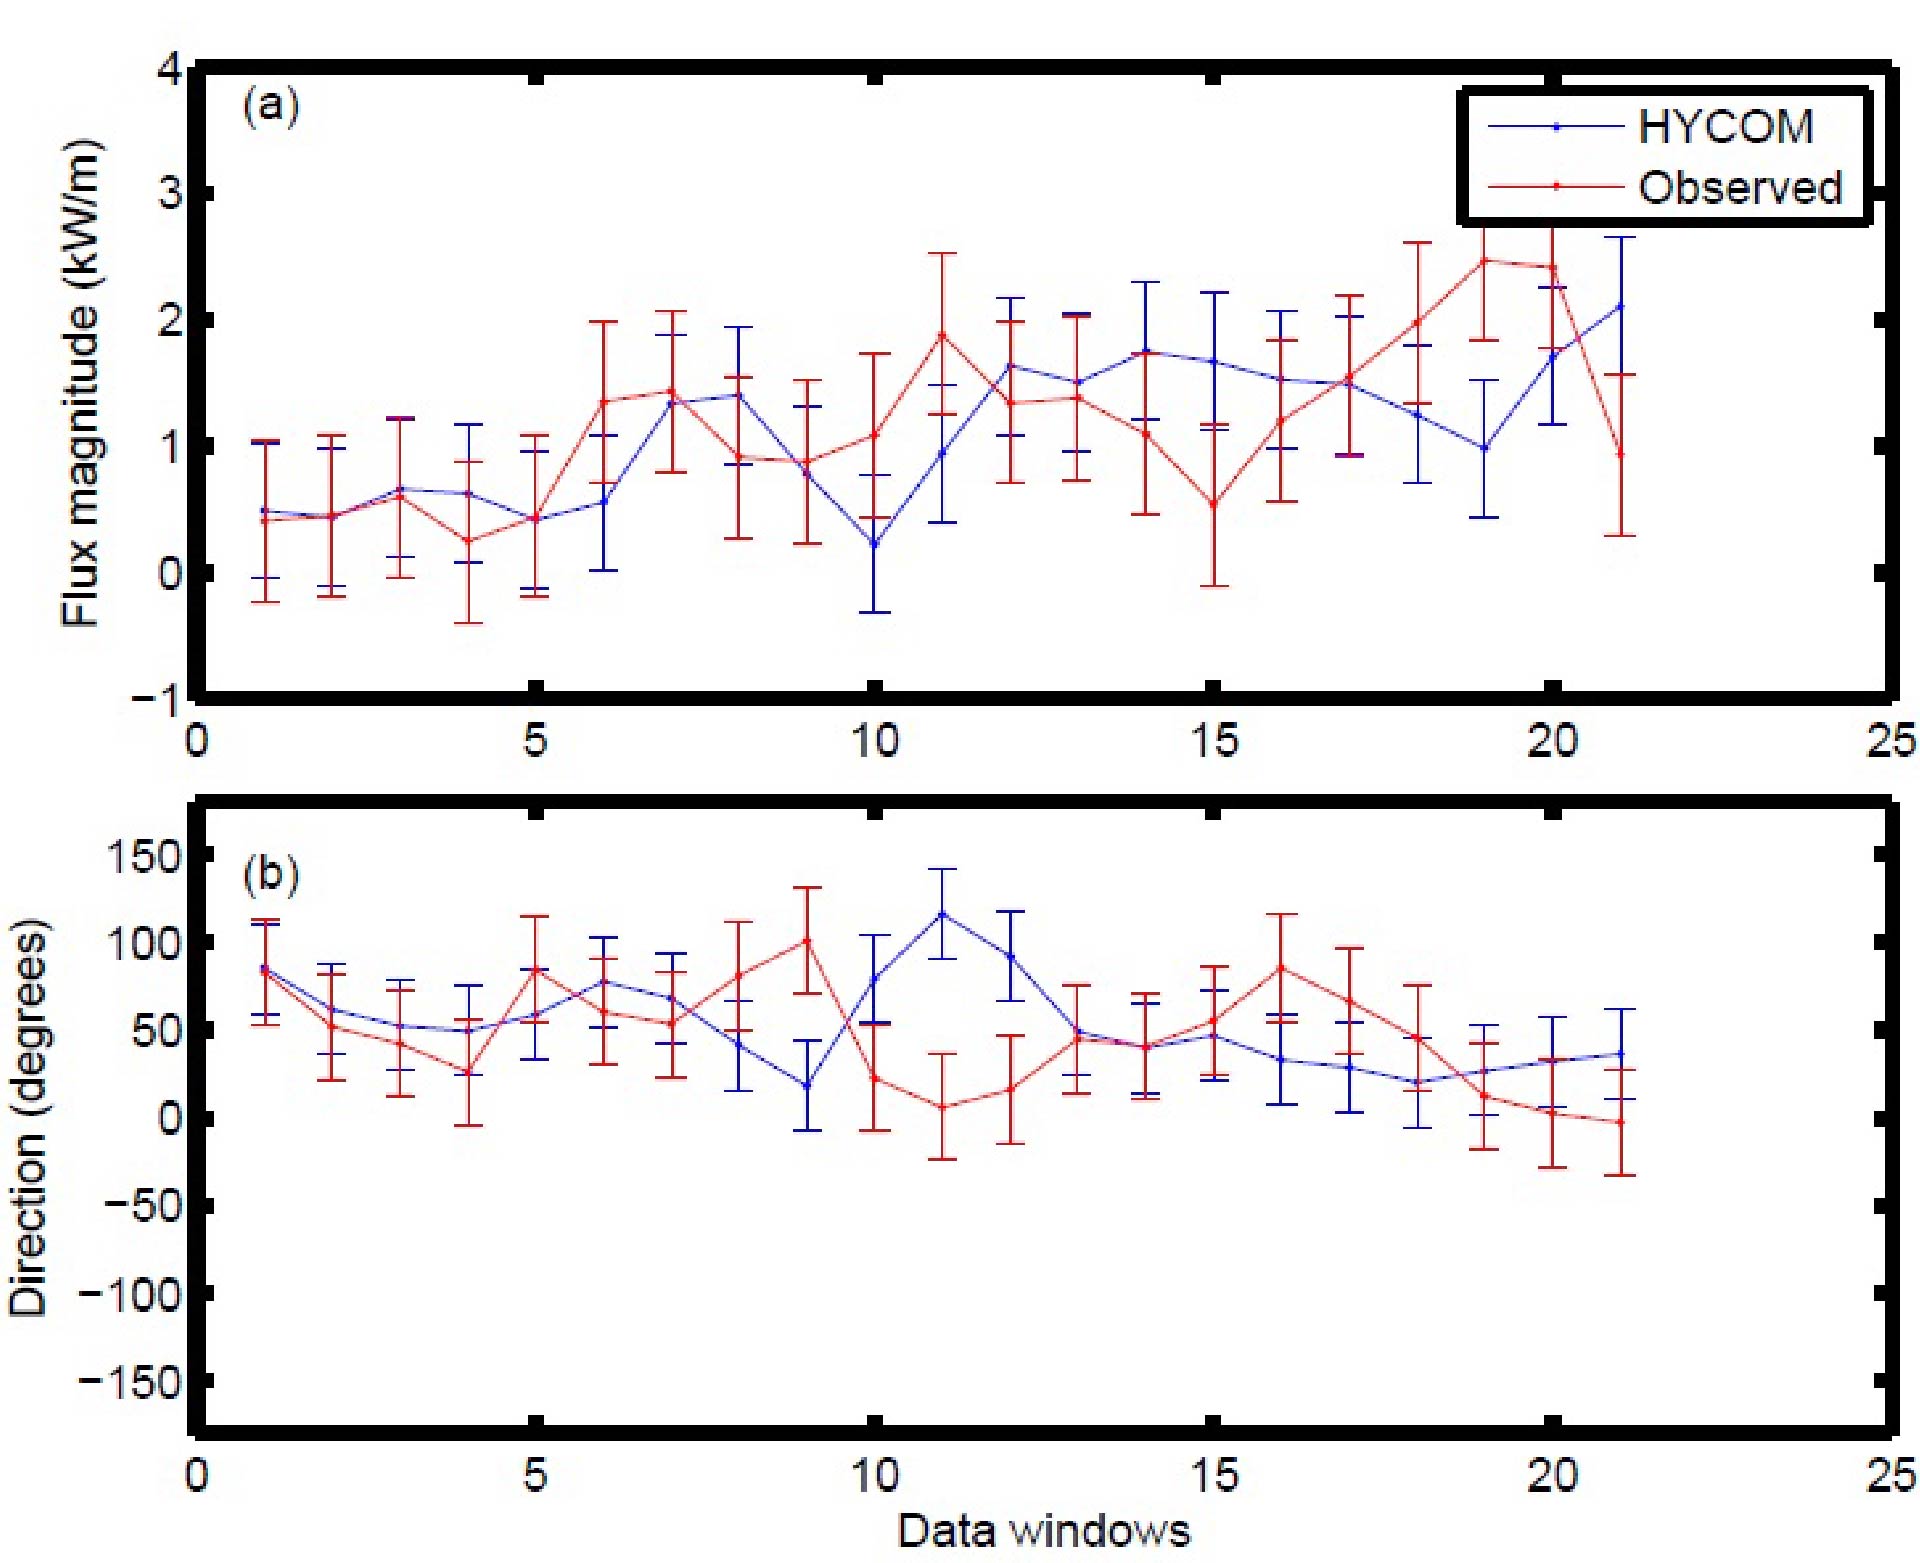
Example time series of 1/25-degree HYCOM semidiurnal mode-1 baroclinic energy flux (a) magnitude and (b) direction; location: latitude=35.55 North, longitude= 142.66 East. The fluxes are divided into 50% overlapping 30-day windows. The vertical bars are envelopes of the magnitude-only [in (a)] and direction-only [in (b)] variabilities computed over all locations. From Ansong et al. (2017).
Our group published the first paper (Müller et al. 2015) showing that high-resolution models with concurrent atmospheric and tidal forcing contain a partial internal gravity wave continuum spectrum.
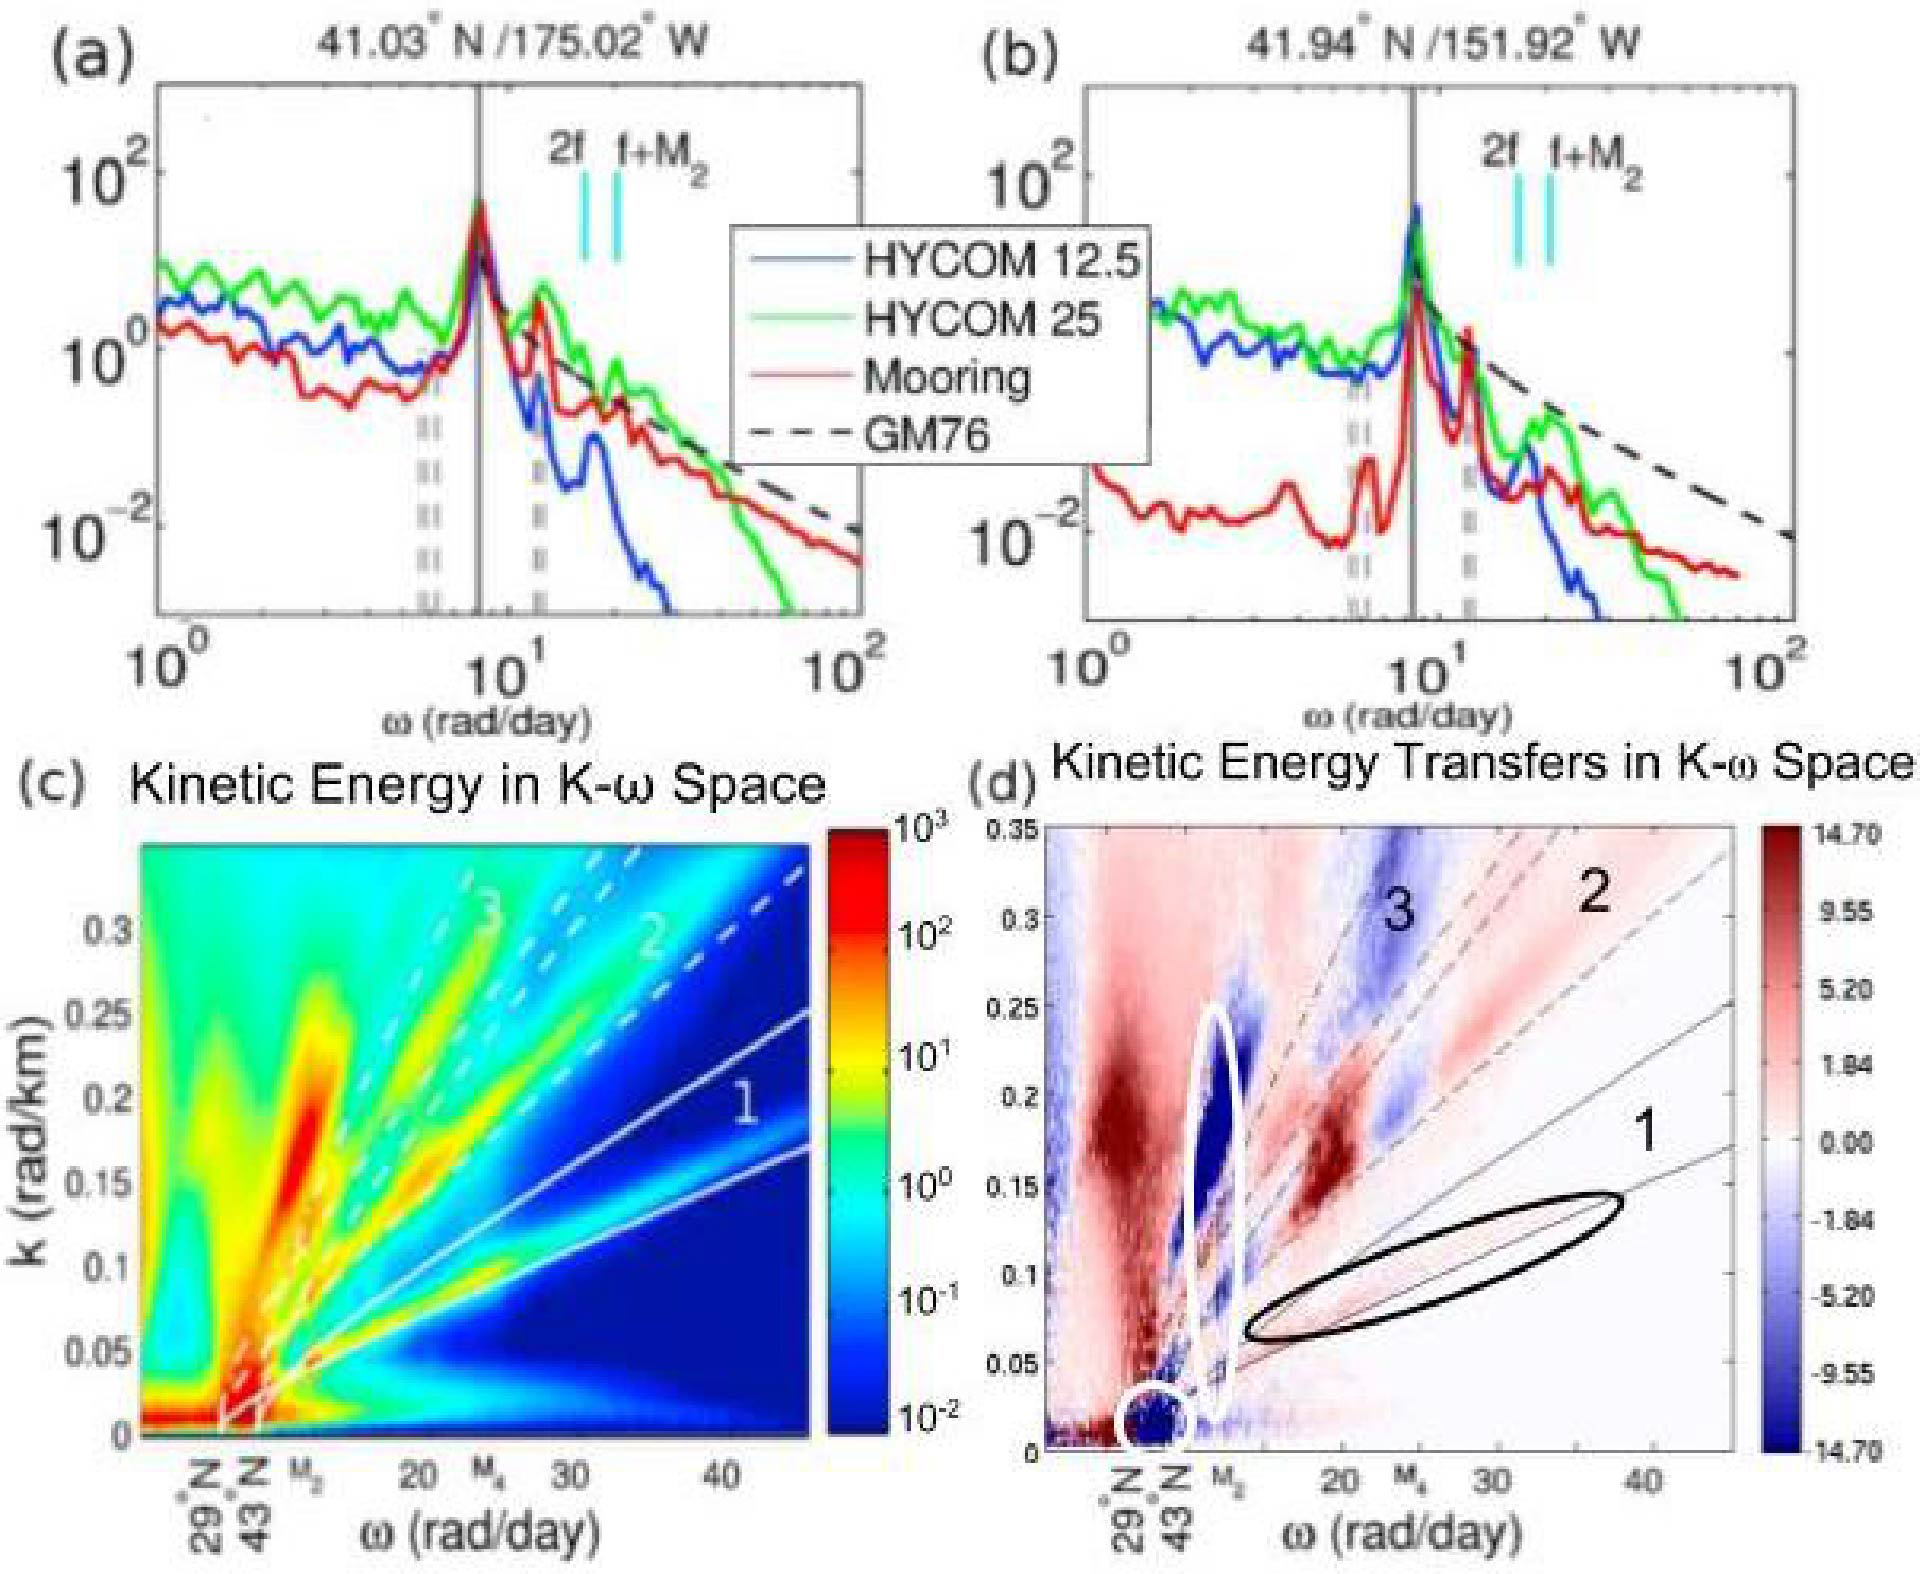
Plot taken from Savage et al. (2017), who in turn adapted it from Müller et al. (2015). (a and b) Frequency spectral density of surface kinetic energy [(m/s)^² day] from 1/12^° and 1/25^° HYCOM (HYCOM12 and HYCOM25, respectively) at two sample North Pacific mooring locations (coordinates given in subplot titles). The mooring spectral density and spectral density from Garrett and Munk (1975), GM76, are also given; see Müller et al. (2015) for details of the GM76 spectra. (c) Surface kinetic energy wave number-frequency spectral density [(m/s)^² day km] computed from HYCOM25 in a box in the North Pacific. High variance is seen along the theoretical wave number-frequency dispersion curves for vertical modes. First mode is represented by solid white curves, second mode by dashed white curves, and third mode by dotted-dashed white curves. (d) Kinetic energy transfers [(10^¯⁹ W/kg) day km] computed from HYCOM25 in frequency-wave number space. Blue (negative) values represent energy being removed from the system while red values represent energy injection. See text of Savage et al. (2017) for description of regions highlighted with ellipses.
Models with concurrent atmospheric and tidal forcing can be used to predict the percentage of variance in various classes of motions.
Savage et al. (2017) made global maps of the non-steric and steric sea surface height (SSH) variance in different frequency bands. The map below shows the steric SSH variance in non-stationary semidiurnal tides and supertidal internal gravity wave continuum motions, both of which will be difficult to extract from satellite altimeter data, which suffers from temporal aliasing problems.
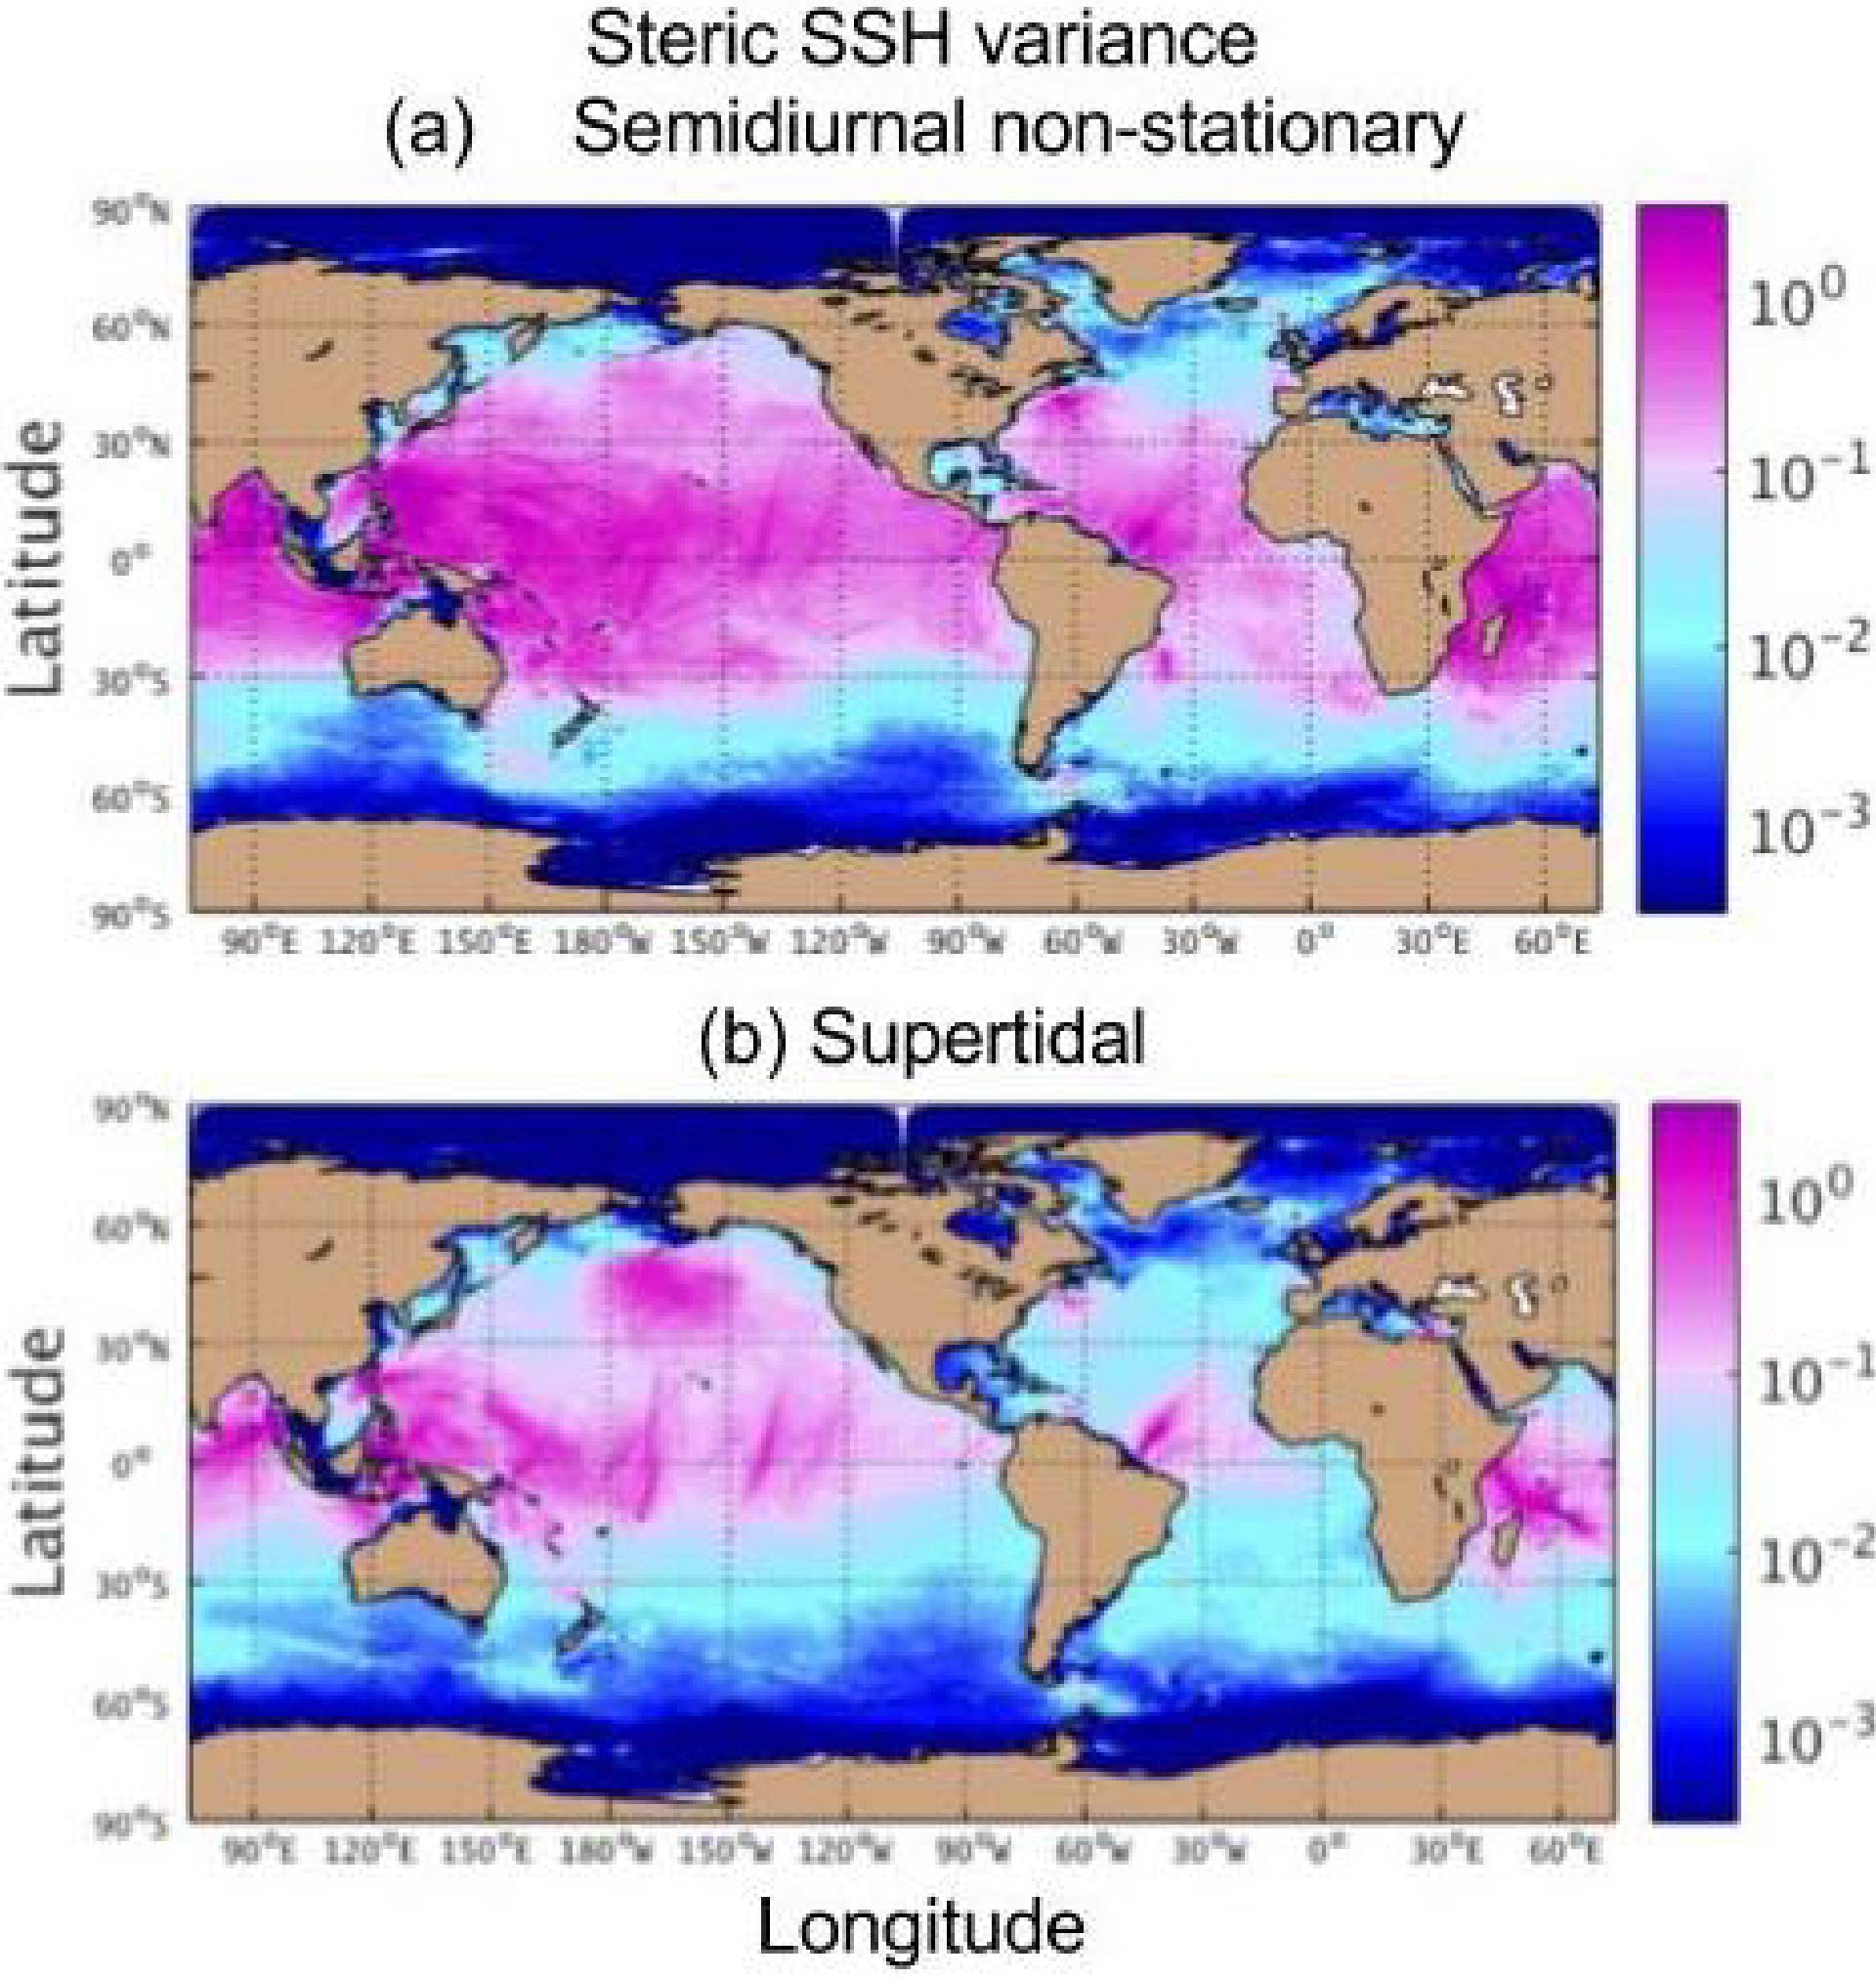
Global maps of steric sea surface height (SSH) variance (cm^²), computed from 1/25th degree HYCOM, in (a) non-stationary semidiurnal motions, and (b) supertidal internal gravity wave continuum motions. From Savage et al. (2017).
Timko et al. (2018—in review) showed that global models with simultaneous atmospheric and tidal forcing can sustain tidal mixing fronts on shelves. Timko et al. (2017) showed that models that employ an enhanced abyssal hill roughness as a stand-in for small-scale variations missing in global bathymetric products see an enhanced tidal energy conversion—see Melet et al. 2013 for a related study based upon linear wave theory. Buijsman et al. (2016) and Ansong et al. (2015) examine the impact of parameterized internal wave drag on the internal tides and tidal energy budgets in our multi-layer HYCOM tidal simulations. Ansong et al. (2015) built upon Shriver et al. (2012) who performed extensive comparisons of the internal tides in our HYCOM wind+tides simulations with along-track altimetry. Richman et al. (2012) demonstrated that the contributions of high-frequency motions to the sea surface height wavenumber spectrum—a quantity of fundamental interest in satellite altimetry—can be as large as the contributions from low-frequency motions.

